Coventry
West Midlands · England · E08000026345,321 people at the 2021 Census. The projection takes the White British share below half between 2021 and 2031. This profile combines observed Census data with clearly labelled modelled projections. Read the methodology and limitations or inspect the official sources.
Coventry had 345,321 residents at the 2021 Census, up 8.9% from 316,960 in 2011. The three largest ethnic groups were White British (55.3%), Asian (18.5%) and White Other (10.2%). This site's Hamilton-Perry model (version 8.0, projected from the 2011 and 2021 Censuses, held within the ONS 2022-based subnational population projections) puts the three largest groups in 2051 at White British (24.6%), Asian (21.5%) and Black (18.5%).
Looking at a street rather than the whole area? Look up your postcode for the local authority and constituency it sits in.
Projected Falls below half between 2021 and 2031
190,889 of Coventry’s 345,321 residents identified as White British at the 2021 Census. The projection takes that share from 55.3% at the 2021 Census to 45.2% in 2031. The model projects 2031, 2041, 2051 and 2061 only, so a decade is as precise as it can be.
Coventry and the councils that border it, on the map
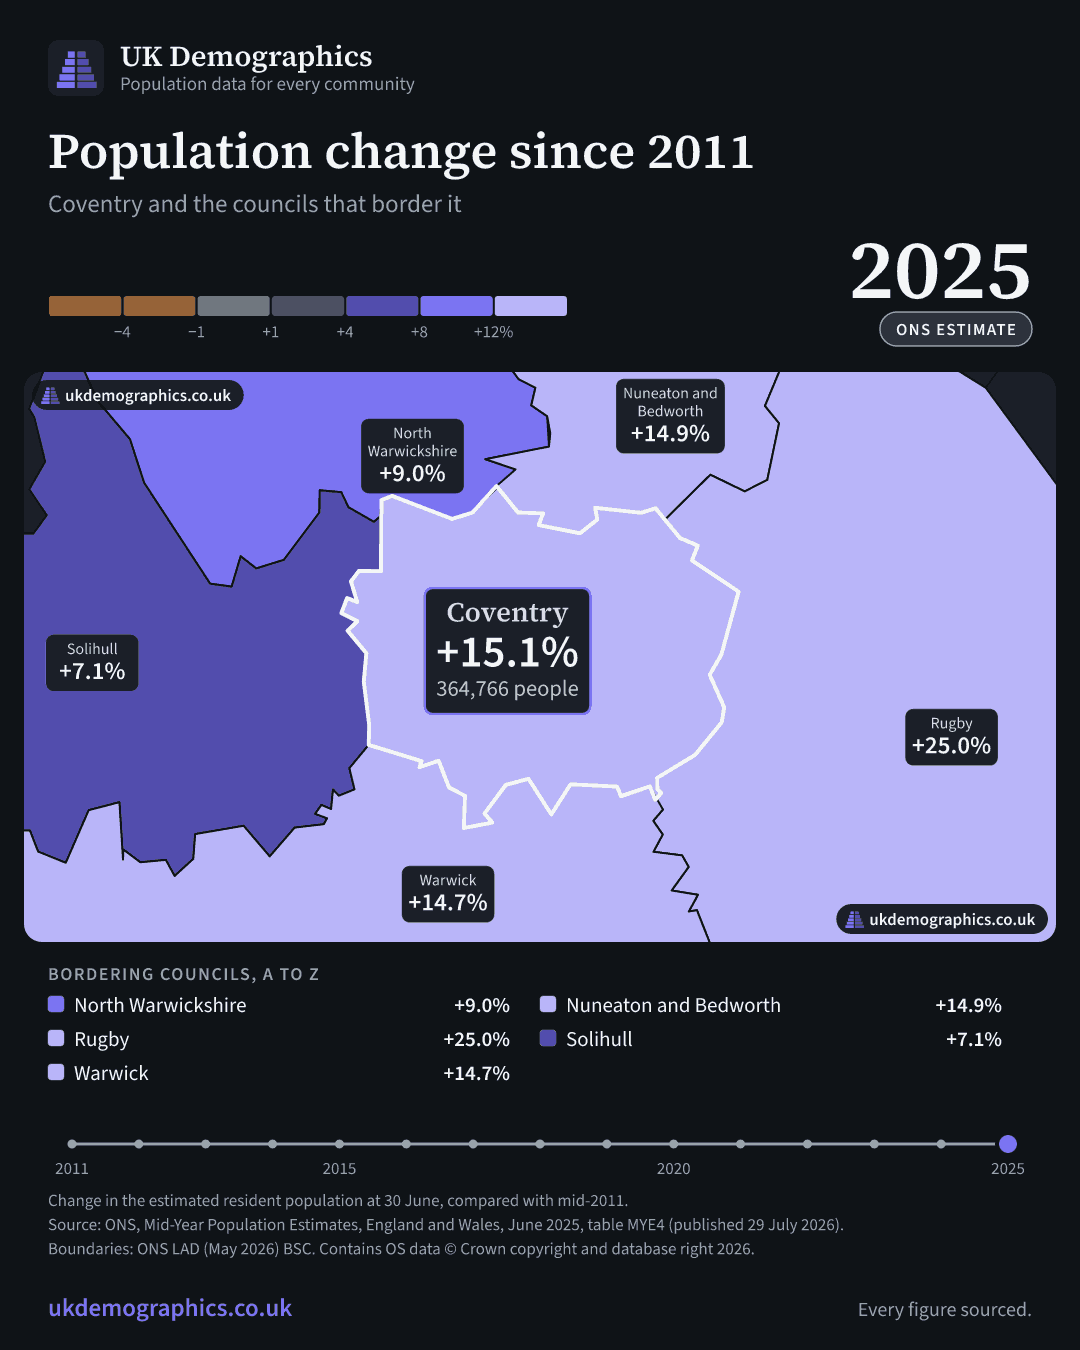
Coventry's estimated population rose 15.1% between mid-2011 and mid-2025, from 316,915 to 364,766 (ONS mid-year estimates, table MYE4). Its White British share fell 11.3 points between the 2011 and 2021 Censuses, from 66.6% to 55.3% (ONS Census 2011 table KS201EW, Census 2021 table TS021).
Population of Coventry, 2011 to 2025
| Council | Mid-2011 | Mid-2025 | Change |
|---|---|---|---|
| Coventry | 316,915 | 364,766 | +15.1% |
| North Warwickshire | 62,089 | 67,688 | +9.0% |
| Nuneaton and Bedworth | 125,409 | 144,042 | +14.9% |
| Rugby | 100,496 | 125,594 | +25.0% |
| Solihull | 206,856 | 221,449 | +7.1% |
| Warwick | 137,736 | 157,925 | +14.7% |
Change since mid-2011, every year
| Council | 2011 | 2012 | 2013 | 2014 | 2015 | 2016 | 2017 | 2018 | 2019 | 2020 | 2021 | 2022 | 2023 | 2024 | 2025 |
|---|---|---|---|---|---|---|---|---|---|---|---|---|---|---|---|
| Coventry | 0.0% | +0.4% | +1.7% | +2.6% | +4.5% | +6.4% | +7.3% | +8.2% | +8.5% | +8.8% | +8.6% | +11.1% | +13.7% | +16.3% | +15.1% |
| North Warwickshire | 0.0% | 0.0% | −0.1% | +0.3% | +1.0% | +1.3% | +2.3% | +3.2% | +3.7% | +3.5% | +5.2% | +6.3% | +6.9% | +8.0% | +9.0% |
| Nuneaton and Bedworth | 0.0% | +0.8% | +1.5% | +2.1% | +2.5% | +3.6% | +4.6% | +5.1% | +6.0% | +6.6% | +7.1% | +8.2% | +10.5% | +12.9% | +14.9% |
| Rugby | 0.0% | +1.0% | +2.3% | +4.2% | +5.8% | +7.0% | +8.1% | +8.9% | +10.5% | +12.1% | +14.3% | +16.2% | +19.1% | +22.1% | +25.0% |
| Solihull | 0.0% | +0.4% | +1.1% | +2.1% | +2.3% | +3.0% | +3.6% | +3.9% | +4.6% | +4.6% | +4.7% | +5.3% | +6.0% | +6.5% | +7.1% |
| Warwick | 0.0% | +1.1% | +1.2% | +1.9% | +2.4% | +3.5% | +4.1% | +5.6% | +6.0% | +6.5% | +8.0% | +10.3% | +11.6% | +12.9% | +14.7% |

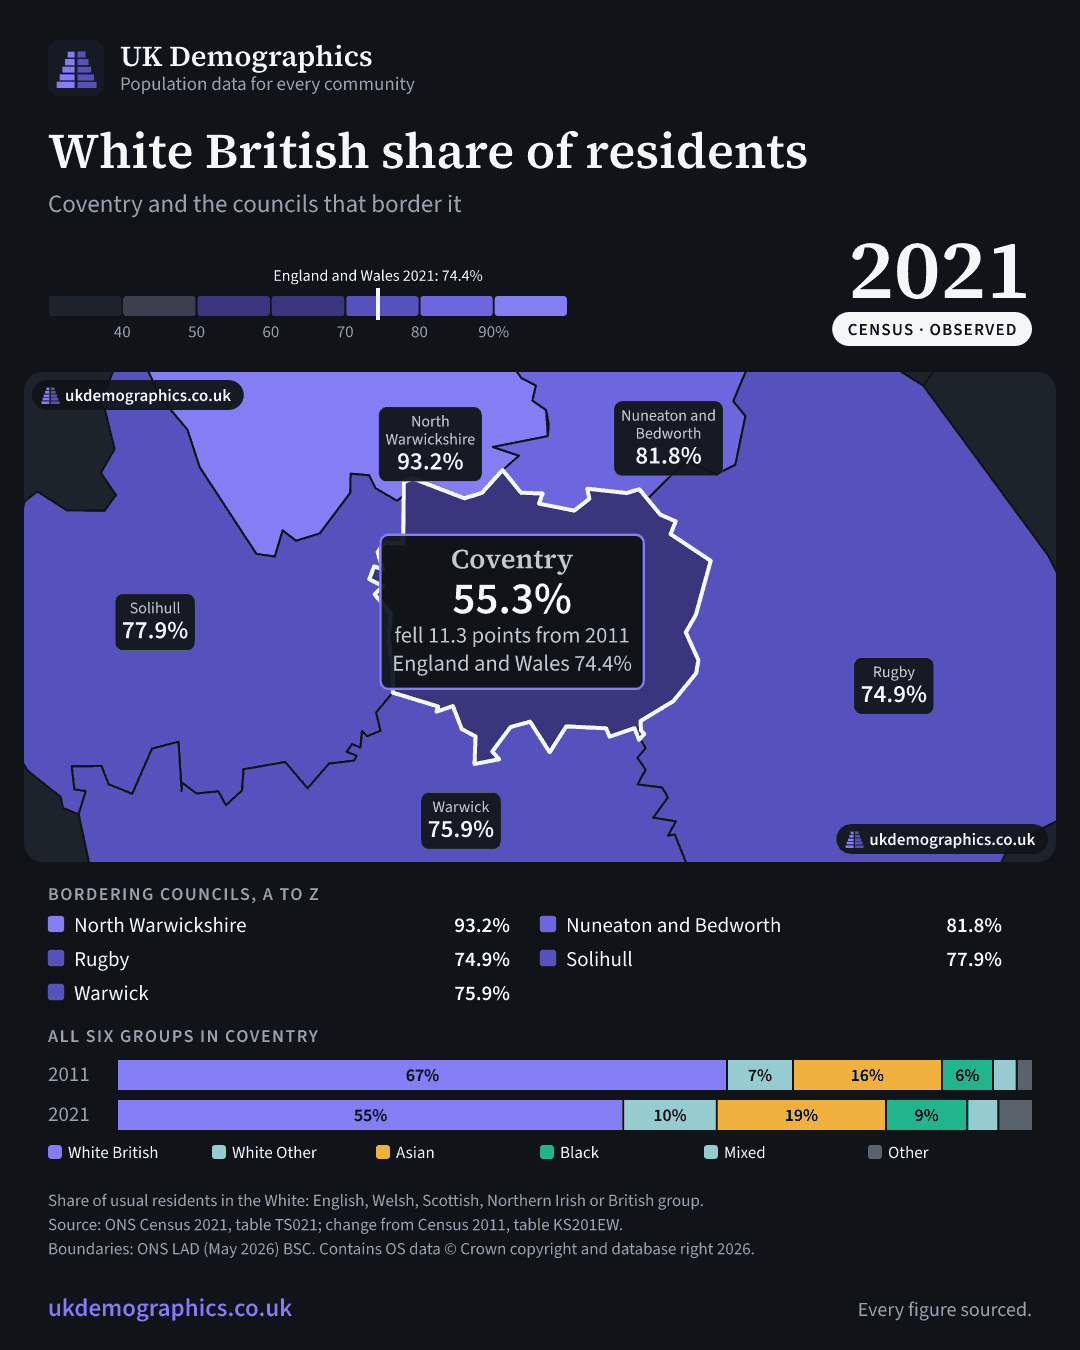
Ethnic groups in Coventry, 2011 and 2021
The map shows the White British share. The bars show all six groups, on one scale, for each council in 2011 and 2021.
- White British
- White Other
- Asian
- Black
- Mixed
- Other
| Council | 2011 | 2021 | Change |
|---|---|---|---|
| Coventry | 66.6% | 55.3% | −11.3 pts |
| North Warwickshire | 95.9% | 93.2% | −2.8 pts |
| Nuneaton and Bedworth | 88.9% | 81.8% | −7.1 pts |
| Rugby | 84.2% | 74.9% | −9.2 pts |
| Solihull | 85.8% | 77.9% | −7.9 pts |
| Warwick | 83.4% | 75.9% | −7.5 pts |
All six groups, 2011 and 2021
| Council | Census | White British | White Other | Asian | Black | Mixed | Other |
|---|---|---|---|---|---|---|---|
| Coventry | 2011 | 66.6% | 7.2% | 16.3% | 5.6% | 2.6% | 1.7% |
| Coventry | 2021 | 55.3% | 10.2% | 18.5% | 8.9% | 3.4% | 3.7% |
| North Warwickshire | 2011 | 95.9% | 1.9% | 0.9% | 0.3% | 0.8% | 0.1% |
| North Warwickshire | 2021 | 93.2% | 3.0% | 1.3% | 0.6% | 1.7% | 0.3% |
| Nuneaton and Bedworth | 2011 | 88.9% | 2.4% | 6.3% | 0.8% | 1.1% | 0.4% |
| Nuneaton and Bedworth | 2021 | 81.8% | 5.3% | 8.0% | 1.8% | 1.8% | 1.2% |
| Rugby | 2011 | 84.2% | 6.3% | 5.2% | 2.0% | 2.0% | 0.3% |
| Rugby | 2021 | 74.9% | 10.8% | 7.6% | 2.7% | 2.8% | 1.1% |
| Solihull | 2011 | 85.8% | 3.4% | 6.6% | 1.6% | 2.1% | 0.6% |
| Solihull | 2021 | 77.9% | 4.3% | 11.0% | 1.8% | 3.5% | 1.5% |
| Warwick | 2011 | 83.4% | 5.8% | 7.2% | 0.7% | 2.0% | 0.9% |
| Warwick | 2021 | 75.9% | 8.7% | 9.7% | 1.1% | 3.0% | 1.6% |

Ethnic composition trajectory
Solid to 2021 is Census. Dashed after that is the model, which was scored against Census 2021 before publication: a mean absolute error of 1.56 percentage points on that one-decade forecast and a bias of +0.05 points, close to unbiased. The shaded band is the 80% interval for White British share.
Ethnic composition, Coventry
White British White Other Asian Black Mixed Other 80% interval
Census, observed Projected, modelled
Show the figures
| Year | White British | White Other | Asian | Black | Mixed | Other |
|---|---|---|---|---|---|---|
| 2011 | 66.6% | 7.2% | 16.3% | 5.6% | 2.6% | 1.7% |
| 2021 | 55.3% | 10.2% | 18.5% | 8.9% | 3.4% | 3.7% |
| 2031 modelled | 45.2% | 12.2% | 20.1% | 12.0% | 4.5% | 6.0% |
| 2041 modelled | 34.3% | 13.9% | 21.4% | 15.4% | 5.8% | 9.2% |
| 2051 modelled | 24.6% | 14.7% | 21.5% | 18.5% | 7.3% | 13.3% |
| 2061 modelled | 16.7% | 14.4% | 20.6% | 21.1% | 9.0% | 18.0% |
Ethnic composition: Coventry
Census 2011, Census 2021, then Hamilton-Perry projections to 2061. Percentages.
White British White Other Asian Black Mixed Other
Two-model comparison: White British, 2051
±5.6pp spread Hamilton-Perry (HP) central 24.6% Cohort change ratios from Census 2011 to 2021. Demographic momentum only, no fertility convergence.
Cohort-component 30.2% Births by ethnicity-specific total fertility rate (TFR) with half-convergence to the national mean by 2061. Slower change.
Two independent models trained on the same Census base disagree by 5.6pp on White British share in Coventry by 2051. HP captures observed 2011 to 2021 cohort dynamics. The cohort-component model adds explicit fertility assumptions that pull projections toward the national mean. The chart above shows HP. See the methodology for why both numbers are published.
Scenario explorer
Under different assumptions, White British share in Coventry ranges from 36.0% to 40.5% by 2051: a 4.5pp spread.
Fertility
Low ~108k/yr
Principal ~315k/yr
High ~476k/yr
Constant Rates stay at current levels
Half convergence Move halfway to national avg
Full convergence Converge to national avg
Migration
Central scenario: WBI 37.9% by 2051
Diversity index
highly diverse Shannon entropy: 0.74 · Dissimilarity: 19.1
Religion
Census 2021 religious composition with projections to 2051.
Religious composition trajectory
Christian No religion Muslim Hindu Sikh
Census, observed Projected, modelled
Show the figures
| Year | Christian | No religion | Muslim | Hindu | Sikh |
|---|---|---|---|---|---|
| 2021 | 46.8% | 31.6% | 11.0% | 4.2% | 5.3% |
| 2031 modelled | 36.3% | 38.6% | 14.5% | 4.5% | 5.0% |
| 2041 modelled | 26.8% | 44.8% | 18.2% | 4.6% | 4.5% |
| 2051 modelled | 18.9% | 49.9% | 21.8% | 4.5% | 3.9% |
Muslim population projected: 21.8% by 2051
Country of birth
UK-born vs foreign-born share, with projection to 2051.
Nativity trajectory
UK-born Foreign-born
Census, observed Projected, modelled
Show the figures
| Year | UK-born | Foreign-born |
|---|---|---|
| 2021 | 72.1% | 27.9% |
| 2031 modelled | 60.8% | 39.2% |
| 2041 modelled | 48.2% | 51.8% |
| 2051 modelled | 35.8% | 64.2% |
English proficiency
Census 2021
Main language English82.5%
Main language not English17.5%
Cannot speak English well3.0%
Cannot speak English at all0.5%
Total population 3+333,212
ONS Census 2021 (TS029) via NOMIS. Reference date 21 March 2021.
Data flag 17.5% of residents aged 3 and over have a main language other than English (Census 2021, TS029), above the 15% line this site uses to flag language demand. A threshold on one Census variable, not a service-planning assessment. This site publishes no projection of language: it models ethnic group, and ethnic composition change is not a measure of language change.
Demographic change and service exposure
A composite score from five capped components. It measures exposure to demographic change, not service cost or capacity, and it has not been validated against observed service demand. See how the score is built.
Ethnic change20/20
Asylum20/20
School16/20
Language18/20
Housing18/20
New arrivals (NINo registrations)
Adults from overseas registering for a National Insurance number, rolling year ending Oct-25 to Dec-25. Coventry ranks at the 98th percentile nationally for total NINo registrations.
Registrations (rolling year)9,673
Year-on-year +4.1%
NationalityRegistrationsShare
India 4,608 47.6%
Nigeria 943 9.7%
China 598 6.2%
Pakistan 430 4.4%
Eritrea 267 2.8%
Sri Lanka 262 2.7%
Ghana 210 2.2%
Nepal 184 1.9%
Romania 160 1.7%
Afghanistan 158 1.6%
DWP National Insurance number allocations to adult overseas nationals (Stat-Xplore NINO database), rolling year ending Q4 2025.. NINo registrations measure new arrivals into the National Insurance system, not total foreign-born population. A NINo is allocated when an overseas national requests one, usually to start work or claim benefits, so the figure misses students and dependants who never enter the labour market. Small (LA × nationality) cells are suppressed by Stat-Xplore for disclosure control.
Arrivals over the last 24 years
Annual NINo registrations to adults from overseas in Coventry from 2002 to 2025, alongside the UK total for context. The peak year was 2022 (16,932 registrations). Total over the full period: 167,488 registrations.
DWP Stat-Xplore, NINO Registrations to Adult Overseas Nationals Entering the UK (Ninos cube), aggregated per calendar year by summing the four constituent quarters. Geography: ONS LA codes. Counts are NEW NINo registrations per calendar year. A NINo is issued once per person at the point of first work or claim, so this is a flow measure, not a stock. People who arrive but never register (some students, dependants, retirees) are excluded. Late registrations show in a later year than the year of arrival. Pre-2010 figures used a different administrative system; series is comparable but small methodological revisions to the early years are possible.
Who is arriving
Age and sex profile of 9,835 NINo registrations to adults from overseas in Coventry in 2025. National comparison shown alongside.
Age at registration
Coventry UK marker
Sex
Male share is 2.9pp higher than the UK average (54.4%).
DWP Stat-Xplore Ninos cube, LA × Age band × Sex, rolling year ending Q4 2025 (January 2025 to December 2025). Counts are NEW NINo registrations to adult overseas nationals. Age is age at NINo registration, not age at arrival. The registration may follow arrival by months. 'Less than 18' is rare in this dataset because the published Ninos series is filtered to adult overseas nationals; values reflect young workers/claimants close to 18. 'Unknown' age is a small residual.
Why people are coming
For each of the top arriving nationalities in Coventry, this is the national mix of visa routes used in 2025. It shows whether arrivals from that country are typically students, workers, on family routes (including refugee family reunion), or in some other category. Local-authority breakdowns of visa routes are not published, so we apply the national mix at nationality level.
India 4,608 in Coventry (47.6%)
Nigeria 943 in Coventry (9.7%)
China 598 in Coventry (6.2%)
Pakistan 430 in Coventry (4.4%)
Eritrea 267 in Coventry (2.8%)
Home Office, Immigration system statistics, year ending June 2026; Vis_D02 (Entry clearance visa outcomes by nationality, visa type, and outcome). Joined with DWP Stat-Xplore NINo registrations rolling year ending Q4 2025. Visa grants are issued at the point of entry-clearance application and are NOT the same population as NINo registrations. Visitor visas (2.24 million in 2025) do not lead to NINo and are excluded from the route-mix percentages so the Work / Study / Family / Other proportions are interpretable. Humanitarian routes (BN(O), Ukraine schemes, Resettlement, Asylum) are surfaced as national totals only because the same nationality split is not provided in this dataset. EU/EEA nationals largely fall outside entry-clearance for short stays, so their NINo flow is materially understated by visa data alone.
How Coventry changed: 2011 to 2021
Two snapshots from two consecutive Censuses, ten years apart. Population changed from 316,960 in 2011 to 345,323 in 2021 (+8.9%). Non-UK-born residents went from 67,233 (21.2% of population) to 96,333 (27.9%).
Group 2011 2021 Change
UK-born 249,727 78.8% 248,990 72.1% -737
Ireland-born 5,821 1.8% 3,865 1.1% -1,956
EU pre-2001 (France, Germany, Italy, etc.) 4,206 1.3% 8,438 2.4% +4,232
EU 2001-2011 accession (Poland, Romania, Bulgaria, etc.) 10,573 3.3% 22,499 6.5% +11,926
Rest of World 46,633 14.7% 61,531 17.8% +14,898
Source: ONS Census 2011 KS204EW (NOMIS NM_611_1) and Census 2021 TS012 (NOMIS NM_2032_1), aligned to broad country-of-birth groups. 2011 data uses 2011 LA boundaries; 2021 data uses 2023 boundaries. LAs whose ONS code changed between Censuses (Buckinghamshire, Northamptonshire, North Yorkshire, Somerset reorganisations) are not in this comparison.
Working and not working, by passport group
Census 2021 employment status of Coventry residents aged 16 and over, by passport held. Three numbers shown per group:
- The first three columns sum to 100% for each row. Every adult is either in work, unemployed, or inactive.
- In work: share of all adults aged 16+ who have a paid job.
- Unemployed: share of all adults aged 16+ who are looking for work but do not have a job.
- Inactive: share of all adults aged 16+ who are not in the labour market. Includes retirees, full-time students, those looking after family, the long-term sick.
- Employment rate (last column): share of those who are trying to work (excluding full-time students) who have a job. Almost always higher than In Work because it leaves out everyone who is retired, raising kids, or in full-time study.
Passport group Pop 16+ In work Unemployed Inactive Employment rate
UK passport 195,023 56.9% 4.2% 38.9% 94.7%
Irish passport 3,690 34.8% 2.6% 62.6% 96.0%
EU member country passport 28,424 69.6% 5.9% 24.5% 94.2%
Rest of Europe (non-EU) 1,084 56.4% 9.4% 34.2% 88.3%
African passport 5,713 54.6% 12.9% 32.6% 87.0%
Middle East / Asian passport 13,463 44.3% 7.8% 47.9% 92.0%
Americas / Caribbean passport 909 53.7% 6.7% 39.6% 90.7%
Oceania / Antarctica passport 137 72.3% 4.4% 23.4% 96.1%
No passport held 28,432 27.7% 5.4% 66.9% 84.5%
ONS Census 2021 RM021, Economic activity status by passports held, by local authority district. NOMIS NM_2121_1. Stock measure on Census Day (21 March 2021). Passports-held is a proxy for nationality (UK = UK passport holder). Employment rate excludes full-time students from the denominator (the standard ONS definition). The 'inactive' category includes retirees, full-time students who do not work, those looking after family, long-term sick, and other reasons.
Schools, first language
Across 123 state-funded schools in Coventry (62,859 pupils, 2025/26), 37.8% have a first language other than English.
Pupils with first language other than English22,994 (37.8%)
Pupils with first language English37,664 (61.9%)
Free school meals31.2%
Source: DfE Schools, Pupils and their Characteristics 2025/26, school-level data aggregated to district. EAL (English as Additional Language) is a household-level signal: children born in the UK to non-English-speaking households count as EAL.
West Midlands labour market
Payrolled employments in the West Midlands region (December 2025). Provides Coventry with regional context. Local-authority RTI is not published; the region is the smallest geography for HMRC's nationality breakdown.
Total employments2,772,400
Non-UK share19.4%
5-year change · Non-EU +212,300
5-year change · EU -17,400
Top industries by non-UK share (West Midlands)
Administrative and support services 35.1%
Transportation and storage 30.3%
Health and social work 25.5%
Accommodation and food service activities 24.9%
Agriculture, Forestry and Fishing 23.7%
Source: HM Revenue and Customs, PAYE Real Time Information, payrolled employments by region and industrial sector, July 2014 to December 2025; the five-year change runs from December 2020. Counts are employments not employees, rounded to the nearest 100; suppressed cells appear as missing.
Crime
Police-recorded crime rates per 1,000 population, Year ending March 2026, ONS. Coventry ranks at the 72nd percentile nationally for total crime rate.
Total crime / 1k89.4
Violent crime / 1k34.8
Theft / 1k30.0
Drug offences / 1k2.8
Year-on-year -7.3%
Police force: West Midlands. It could not place 1.2% of the offences it recorded in this period in any area, and those offences are in no area's figure.
ONS, Crime in England and Wales: Police Force Area data tables, year ending March 2026 (released 23 July 2026), Tables C1, C2 and C5, police recorded crime from the Home Office; rates per 1,000 residents on ONS mid-2025 population estimates. Police recorded crime is shaped by recording practice, reporting rates and policing priority, and city centre rates are inflated by small resident populations. Offences a force could not place in any area are left out of area figures; each area shows its force's unassigned share.
Adult social care
Council spending on adult social care (2024-25) and residential care for people aged 65 and over (2024-25), against each age group's population in the ONS mid-2025 estimates. Spend per adult ranks at the 41st percentile nationally.
Gross spend per adult (18+), 2024-25£603
Aged 65+ in residential care per 10,000 aged 65+, 2024-25157
Department of Health and Social Care, Adult social care finance report, England: 2024 to 2025, Table 14; Department of Health and Social Care, Adult social care activity report, England: 2024 to 2025, Table 34; Office for National Statistics, Mid-Year Population Estimates, England and Wales, June 2025, for the per-head rates. Adult social care is run by upper tier councils (counties, unitaries, metropolitan districts and London boroughs), so a district shows its county's figures. Spend reflects age structure, deprivation and unpaid care, so differences between councils are not a measure of efficiency. Activity figures are official statistics in development.
Department of Health and Social Care change note on the activity report, 7 October 2026: “Added notice of planned corrections to the 2024 to 2025 activity report, affecting data submitted by some local authorities. Updated figures will be published alongside the 2025 to 2026 activity report.”
Health by ethnic group
Share reporting "not good health" in each of Coventry's largest ethnic groups, Census 2021.
White 20.7%
White: English 22.2%
Asian 13.9%
ONS Census 2021 (RM043 - General health by ethnic group by age) via NOMIS. All ages, no age-standardisation: younger ethnic-group populations will show lower rates partly because they're younger, not necessarily because they're healthier. Group labels shortened for display.
Special educational needs
EHCPs and primary need breakdown, 2025/26 academic year. 5-year EHCP growth ranks at the 58th percentile nationally.
Pupils with an EHC plan, % of pupils4.8%
Pupils with an EHC plan3,029
Autism, share of EHC plans35.3%
5-yr growth +66.2%
Autistic spectrum disorder 35.3%
Speech, language and communications needs 22.7%
Moderate learning difficulty 12.3%
Social, emotional and mental health 11.5%
Severe learning difficulty 8.3%
Profound and multiple learning difficulty 2.6%
DfE, Special educational needs in England, academic year 2025/26, published 11 June 2026, Explore Education Statistics: pupils in all schools by type of SEN provision, and pupils with an EHC plan by primary type of need. SEND is run by upper-tier councils, so district pages show their county. Figures count pupils on the January school census who have an EHC plan; plans held by children under school age, young people in further education and those not in school are not included. The autism figure is the share of pupils with an EHC plan whose primary need is autism, not a prevalence in the population. Rising numbers may reflect identification, diagnosis and parental awareness as well as need.
How NHS care for overseas residents is funded (national context)
Most non-UK residents in Coventry pay for NHS care up-front through the Immigration Health Surcharge (IHS), which is added to most visa applications. Asylum seekers, refugees, ILR holders and Irish citizens are exempt. Visitors and undocumented residents are charged at 150% of the national NHS tariff. The figures below are England + Wales national totals; per-LA NHS cost-recovery is not centrally published.
Current IHS rate (adult, per year) £1,035
IHS rate, students/under-18s (per year) £776
IHS revenue 2024/25 (£m) £1,315.6m
Cumulative IHS revenue 2015-2024 £6.9bn
IHS rate history
- From 2015-04-06: £200/year adult, £150/year students/under-18s
- From 2019-01-08: £400/year adult, £300/year students/under-18s
- From 2020-10-27: £624/year adult, £470/year students/under-18s
- From 2024-02-06: £1035/year adult, £776/year students/under-18s
Indicative charges for visitors and undocumented residents
Maternity care is classified as "immediately necessary": it cannot be refused or delayed for charging, but it is invoiced afterwards at 150% of the NHS national tariff.
- Routine vaginal delivery, no complications: £3,000-£5,500
- Caesarean section: £5,000-£7,500
- Premature birth with NICU stay: £15,000-£30,000+
- Antenatal appointment: £150-£400 each
Sources: NHS (Charges to Overseas Visitors) Regulations 2015 (as amended); Home Office IHS caseworker guidance (Sept 2025); House of Commons Library briefing CBP-7274; NHS England NHS Payment Scheme (national tariff). Approximately 80% of identified overseas-visitor debt across all NHS treatment is uncollected (NAO, follow-up scrutiny).
Economic profile
Avg employment rate43.2%
Avg home ownership40.7%
Avg social rent12.5%
Degree or above22.4%
No qualifications14.1%
Housing
Composition today
How dwellings in Coventry are occupied. Single-person households and houses in multiple occupation are the two cleanest signals.
Single-person discount take-up34.9%
Dwellings on 25% single-person discount50,152
HMO dwellings (Census 2021)2,078
HMOs per 1,000 population6.02
Sources: MHCLG Council Taxbase 2025 (CTB, snapshot 6 October 2025) for single-person discount; ONS Census 2021 RM192 for HMO dwellings. HMO Census numbers reflect dwellings classified as HMO on Census Day; current licensing registers held by individual councils are not centrally published.
Tenure by ethnic group
Household ownership rates for Coventry's largest ethnic groups, Census 2021.
White: owned 61.9%
White: English: owned 65.8%
Asian: owned 64.5%
ONS Census 2021 (RM134 - Tenure by ethnic group, Household Reference Persons) via NOMIS. Group labels shortened for display.
Tenure projection
Census 2021 tenure patterns by ethnicity, projected to 2041 from demographic composition change.
Ownership (2021)40.7%
Social rent (2021)12.5%
Private rent (2021)19.4%
Ownership (2041)32.1%
Social rent (2041)11.1%
Social rent change-1.4pp
Data flag The foreign-born share is projected to rise by 36.3pp between 2021 and 2051 (Census 2021 TS004 country of birth, projected by the Hamilton-Perry method), above the 15pp line this site uses to flag housing demand. A threshold on one projected variable, not a housing-need assessment.
School demographics
DfE School Census 2024/25. 60,774 pupils.
White British pupils39.1%
Minority pupils60.9%
EAL growth (projected)+16.2pp
White British gap (school vs population)16.2pp
Schools are 16pp more diverse than the general population (schools show the future).
Westminster constituencies
Parliamentary constituencies overlapping Coventry, listed A to Z. The percentage shown is the share of each constituency's postcodes that fall in Coventry.
Asylum and immigration data
Asylum seekers on support, hotel costs, grant rates, and the True Cost of Asylum for this area.
View Coventry on Asylum Stats →
Local geography The shared local-authority geography record and its source coverage. Place record on UK Places